

Understanding OI Reaccumulation: A Signal Few Traders Catch
In the world of derivatives and futures trading, Open Interest (OI) often plays second fiddle to price action and volume. But seasoned traders know that it can be a goldmine of signals—especially when it comes to anticipating breakouts. One of the most overlooked yet powerful patterns is OI reaccumulation. Simply put, reaccumulation in OI suggests that after a period of profit-taking or consolidation, positions are quietly building up again—hinting at potential explosive moves.
What is OI Reaccumulation and Why Should You Care?
OI reaccumulation occurs when, after a decline or sideways movement in price, open interest begins to rise again—without a corresponding increase in volatility. This indicates that positions are being rebuilt, typically by institutions or large players, ahead of a significant directional move. In contrast to a sudden spike in OI during a breakout, reaccumulation happens stealthily, often going unnoticed until it’s too late for retail traders to catch the wave.
Case Study: Bitcoin Futures (2020-2021)
A strong example came in the months leading up to Bitcoin’s massive breakout above $20,000 in late 2020. After a summer of sideways action, BTC futures on CME showed a gradual reaccumulation in OI—from 9,000 to over 13,000 contracts—while price remained within a $2,000 range. This indicated strong institutional interest building up, even as price action bored most traders. When the breakout finally came in December, BTC surged to $40,000 in just a few weeks. Traders tracking OI reaccumulation had the conviction to hold through the chop.
Statistical Evidence: Numbers Don’t Lie
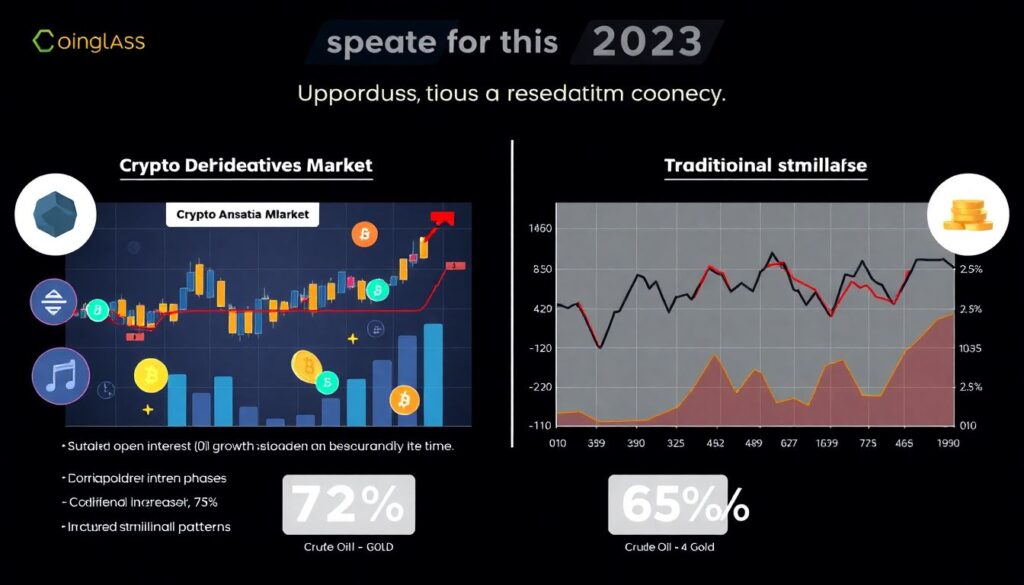
Research by Coinglass and Skew Analytics in 2023 found that in crypto derivatives, sustained OI growth during consolidation periods led to breakouts 72% of the time. In traditional markets like crude oil and gold, the correlation was slightly lower—around 65%—but still statistically significant. More importantly, these breakouts tend to be stronger and more durable compared to those without OI reaccumulation, with average post-breakout moves of 12-18% over two weeks.
Key Indicators During Reaccumulation
1. Gradual rise in OI with flat to slightly bullish price action
2. Volume tapering off, indicating lack of speculative noise
3. Funding rates neutral or slightly negative
4. Sentiment indicators showing fear or neutrality
5. Low implied volatility compared to historical average
Each of these factors reinforces the likelihood that the market is being underestimated by the crowd—while smart money positions itself for the next leg.
Market Forecast: Where Reaccumulation Signals Are Flashing Now
Looking ahead to Q3 2024, several assets are showing signs of OI reaccumulation. Ethereum futures have seen a 15% increase in OI since mid-May, even as ETH trades within a narrow $100 range. Meanwhile, the Nasdaq-100 E-mini futures (NQ) are showing a similar pattern post-Fed announcement, with OI climbing despite lackluster price movement. If historical trends hold, we could be on the verge of significant breakouts in both arenas by late summer.
Economic Context: Why It Matters in the Bigger Picture
OI reaccumulation often coincides with periods of macro uncertainty—such as rate hike pauses, earnings seasons, or geopolitical tension—when large players reposition quietly. In 2024, with inflation stabilizing and central banks pausing hikes, institutions are re-entering the markets cautiously. This slow buildup of OI reflects a cautious optimism, and breakouts from these setups often align with fresh macro narratives gaining traction.
Industry Impact: From Individual Traders to Exchanges

For institutional desks, recognizing OI reaccumulation allows better timing and risk management. Instead of chasing breakouts, they position early. For exchanges, these patterns lead to volume surges post-breakout, boosting fee revenue. Retail-focused platforms are now enhancing OI analytics for users, with tools like TradingView and Binance Futures offering visual OI overlays. This democratization of data means the edge is no longer reserved solely for quants and hedge funds.
Case Study: Tesla Options Reaccumulation (Q1 2023)
After a brutal 2022, TSLA options started showing unusual OI increase in March 2023, especially in long-dated calls. Price was still rangebound around $180. Yet, over 3 million contracts were added across strikes from $200 to $250. By April, the stock broke out to $250+, delivering over 30% gain in under a month—again confirming how reaccumulation often precedes strong moves.
Final Thoughts: Spotting the Quiet Before the Storm
OI reaccumulation is like a whisper in a noisy market. Most traders miss it because they’re looking for loud signals like volume spikes or breakout candles. But if you train your eye to spot the slow build-up in OI—especially during dull periods—you’ll be ahead of the curve. The key is patience and context: not every rise in OI means a breakout, but when combined with other data points, it becomes a powerful tool in your trading arsenal.
In short, next time the market feels “boring,” take a closer look at OI. Someone might be quietly placing their bets—and now, you’ll know how to spot them.