
Understanding Open Interest: Definitions and Structural Layers

Open Interest (OI) refers to the total number of outstanding derivative contracts, such as futures or options, that have not been settled. It is a vital metric in derivative markets, indicating the flow of money and the level of market activity. When dissected by maturity and instrument, OI becomes a multidimensional indicator, offering granular insights into market positioning over time and across asset classes. Maturity refers to the time remaining until a contract’s expiration, while instrument denotes the specific underlying asset or derivative type (e.g., equity options, interest rate swaps, commodity futures).
Layered Visualization: OI by Maturity Buckets
A layered view of Open Interest by maturity involves segmenting contracts into predefined tenor buckets—typically short-term (0–3 months), mid-term (3–12 months), and long-term (12+ months). This stratification reveals temporal risk appetite and hedging strategies. For instance, in 2024, equity index options exhibited 53% of total OI in the short-term bucket, with a noticeable skew toward weekly expiries. Conversely, interest rate derivatives, such as Eurodollar futures, showed a more balanced distribution, with 41% in mid-term maturities, reflecting institutional hedging against medium-term rate movements.
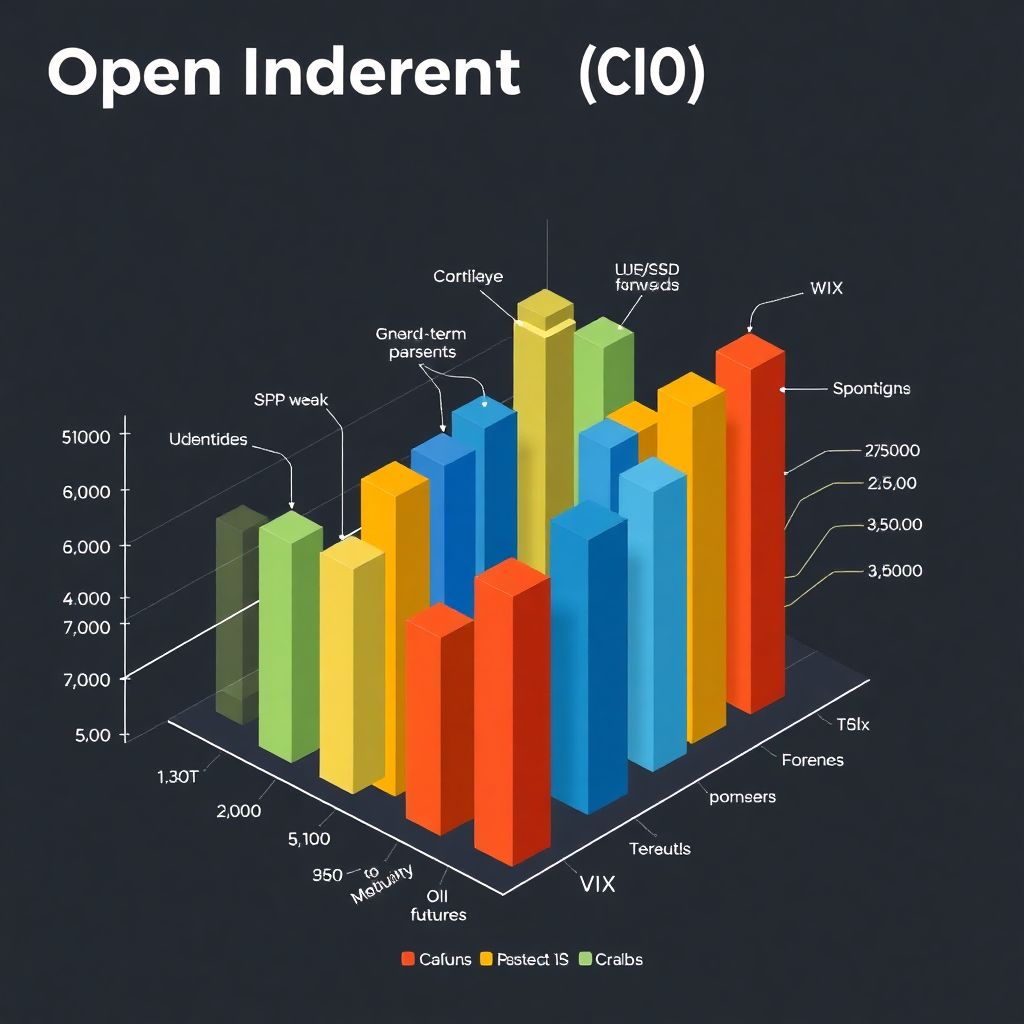
Imagine a 3D bar graph, where the x-axis represents instruments (e.g., S&P 500 options, WTI futures, EUR/USD forwards), the y-axis denotes OI volume, and the z-axis captures maturity bands. Each block represents aggregated OI, allowing visual comparison across instruments and time horizons.
Instrument-Specific OI Dynamics: 2022–2024 Trends
Between 2022 and 2024, notable shifts emerged in OI composition across instruments. In commodity markets, particularly crude oil futures, there was a marked increase in long-dated OI. In 2022, only 12% of WTI crude oil futures OI was held in contracts expiring beyond one year. By Q4 2024, this figure rose to 19%, reflecting growing demand for long-term exposure amid geopolitical uncertainty and energy transition narratives.
In contrast, equity derivatives displayed increased front-loading. The notional OI for weekly S&P 500 options nearly tripled from $180 billion in 2022 to $525 billion in 2024, driven largely by retail adoption and the rise of zero-day-to-expiry (0DTE) strategies. These instruments accounted for over 60% of short-term OI by the end of 2024, underscoring a structural shift toward ultra-short-term speculation.
Comparative Analysis: OI Distribution vs. Volume-Based Metrics
While trading volume reflects market activity within a specific time frame, OI represents the accumulation of open positions. Comparing the two offers deeper insights. For example, in 2023, total daily volume in interest rate swaps exceeded $1.2 trillion, yet OI remained comparatively stable around $350 billion notional. This divergence suggests high turnover but low position holding, typical in speculative environments.
In contrast, commodity futures like gold showed alignment between high OI and consistent volume. From 2022 to 2024, gold futures maintained an average daily volume of 400,000 contracts, while OI hovered around 600,000 contracts. The ratio of OI to volume remained stable, indicating persistent hedging interest rather than short-term speculation.
Case Study: Interest Rate Derivatives Post-Rate Hike Cycle
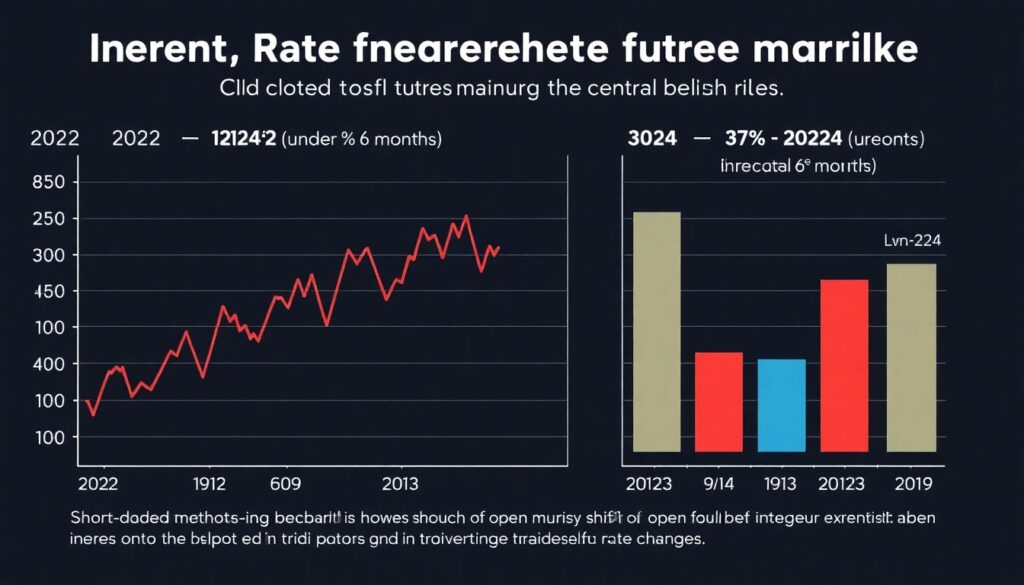
Following the 2022–2023 rate hike cycle by central banks, interest rate futures experienced a maturity shift. In 2022, short-dated Eurodollar futures (under 6 months) dominated with 64% of OI. By mid-2024, longer maturities (12–24 months) grew to capture 37% of OI, as traders began pricing in potential rate cuts and yield curve normalization. This shift was particularly evident in the SOFR futures market, where contracts expiring in 2026 saw a 45% increase in OI from 2023 to 2024.
This evolution illustrates how OI by maturity can act as a forward-looking barometer for interest rate expectations, especially when paired with instrument-specific analysis.
Volatility Instruments: Skewed OI and Maturity Compression
Volatility-linked instruments such as VIX futures and options exhibit unique OI characteristics. From 2022 to 2024, VIX futures showed a contraction in long-dated OI, with over 70% of contracts concentrated in the front two months by the end of 2024. The average maturity of active VIX OI dropped from 3.2 months in 2022 to 1.6 months in 2024. This maturity compression implies increased short-term hedging demand, likely due to macro uncertainty and headline-driven volatility.
Graphically, this would resemble a sharply declining curve when plotting OI against time-to-expiry, highlighting the front-loading bias in volatility hedging.
Limitations and Alternative Approaches
Despite its depth, OI segmented by maturity and instrument has constraints. It does not capture directional bias (long vs. short) or delta-adjusted exposure. Alternative metrics such as the Commitments of Traders (COT) report or gamma exposure profiles (GEX) provide complementary perspectives. For example, in 2024, COT data revealed that commercial hedgers held net short positions in crude oil futures, even as long-dated OI increased—indicating defensive positioning rather than bullish bets.
Furthermore, synthetic exposures via structured products or OTC derivatives may not be reflected in exchange-traded OI data, limiting visibility in certain asset classes.
Conclusion: Strategic Implications of a Layered OI View
Analyzing Open Interest through the layered lens of maturity and instrument unlocks a nuanced understanding of market structure, liquidity concentration, and temporal risk sentiment. From the rise of short-dated equity options to the reallocation in interest rate futures, the 2022–2024 period underscored the dynamic interplay between macroeconomic events and derivative positioning. For traders, risk managers, and regulators, this multidimensional approach offers actionable intelligence—especially when integrated with volume, volatility, and positioning data. As financial markets evolve, such layered views will be indispensable in navigating complexity and anticipating structural shifts.