

Understanding Open Interest Consolidation
Open interest — that often-overlooked metric hiding in plain sight on your options or futures chart — can quietly tell you when the market is brewing something big. When we talk about “open interest consolidation,” we’re referring to a period where the number of outstanding contracts doesn’t significantly rise or fall, even as prices may fluctuate. This kind of stalling behavior in open interest is like a deep breath before a sprint — it often precedes explosive breakouts in price action.
Why Traders Shouldn’t Ignore It
Let’s break it down with an example. Imagine a stock trading in a tight range for days, while open interest across key strike prices remains flat. That tells you that neither bulls nor bears are exiting or entering in large numbers — they’re watching, waiting. When that balance breaks, and open interest suddenly spikes alongside price, it can signal the start of a major directional move. Seasoned traders watch for this shift like hawks. It’s not a standalone trigger, but when paired with volume and price action, it’s a powerful confirmation.
Statistical Observations: What the Numbers Say
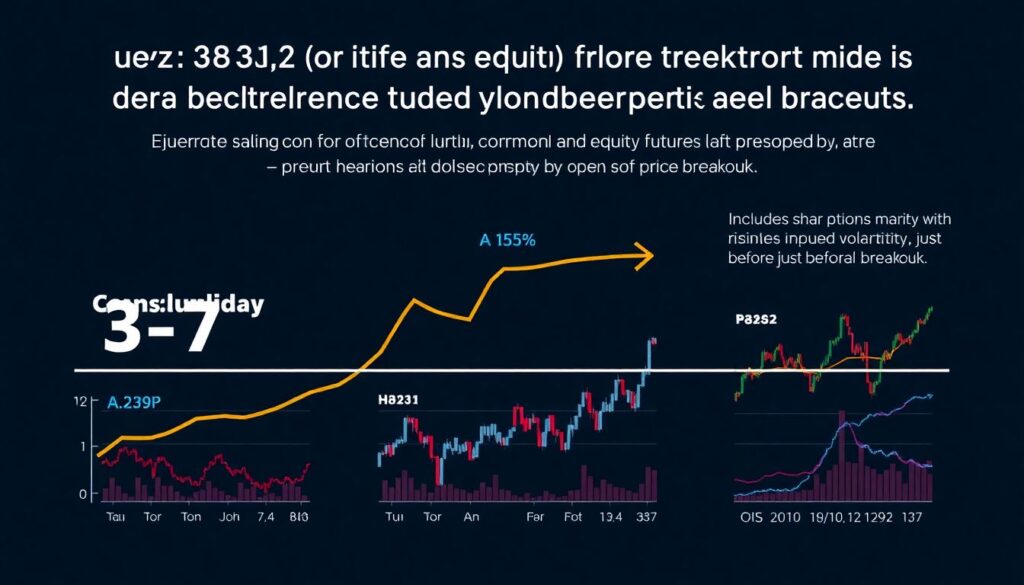
According to a 2023 study by CME Group, over 68% of major price breakouts in commodity and equity futures were preceded by a 3-7 day period of open interest consolidation. In options markets, similar patterns were observed, with implied volatility often rising just before a breakout, while open interest remained static. That suggests market participants were positioning themselves — but not aggressively enough to tip off the direction. This “quiet buildup” tends to occur before earnings reports, economic data releases, or macro events.
Interestingly, the same study found that when open interest increased by more than 15% in a single session after a consolidation phase, the resulting price move (over the next five sessions) averaged 3.8% in the breakout direction. In other words, smart money waits — and then pounces.
Economic Implications of Open Interest Patterns
Open interest consolidation doesn’t just affect technical traders. It reflects broader economic sentiment. When institutions pause their exposure in futures or options markets, it often correlates with periods of uncertainty — think interest rate decisions, geopolitical tensions, or inflation data. The consolidation of open interest suggests that capital is on the sidelines, waiting for clarity. When the breakout comes, it’s usually because that clarity has arrived.
This behavior ties into risk management too. Funds often reduce leverage or hedge positions during consolidation, leading to flat open interest. Once the risk profile shifts, positions are re-established. That’s why open interest spikes sharply after the breakout — capital is re-entering the game.
Forecasts: Where This Trend Is Heading
Looking ahead, the relevance of open interest consolidation as a predictive indicator will likely grow. With algorithmic trading models becoming more sophisticated, open interest data is increasingly being integrated into machine learning systems for breakout prediction. A 2024 report by QuantInsti revealed that hedge funds are already using open interest consolidation zones as one of the top five predictive features in options-based trading algorithms.
Moreover, as retail traders gain access to better analytical tools, including real-time derivatives data, we’re likely to see a wider adoption of open interest strategies. Platforms like Thinkorswim and TradingView are already integrating open interest visuals into their charting software, making it easier for individual traders to spot these quiet zones before the storm.
Impact on the Trading Industry
This shift is already reshaping how traders operate. Market makers, for instance, are becoming more cautious during consolidation periods, widening spreads to account for potential volatility. Meanwhile, educational platforms are ramping up their focus on derivatives analytics, as demand from retail and institutional clients grows. We’re moving toward a market environment where understanding open interest isn’t optional — it’s essential.
Also worth noting: exchanges themselves are responding. CBOE and CME have started publishing more granular open interest data, including time-based distribution and strike-level changes. This transparency is a game-changer, making it easier for traders to identify where the “smart money” is sitting.
Practical Application: How to Use It in Your Strategy
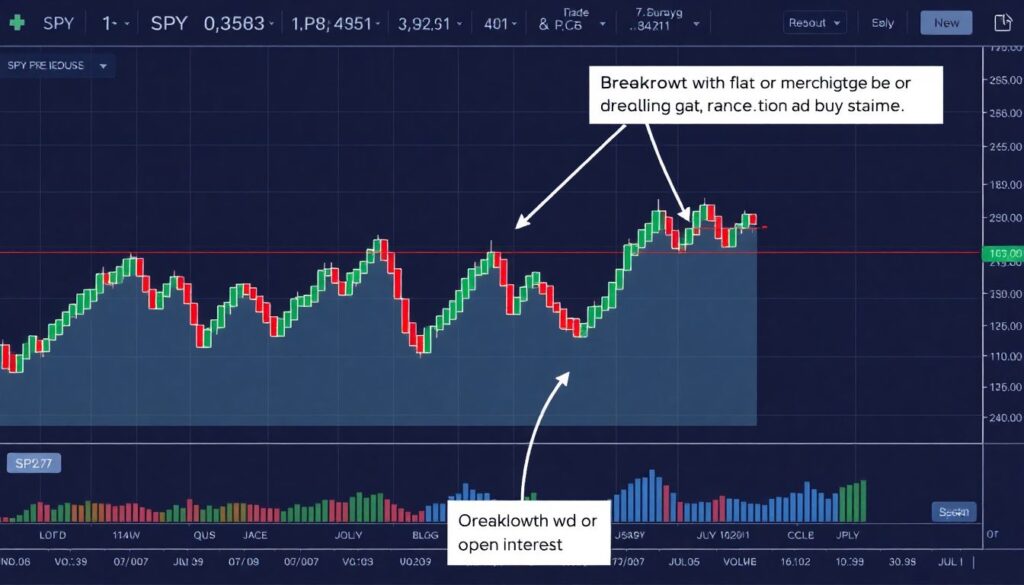
So, how do you use open interest consolidation in real trading? First, identify assets in a tight price range with flat or slightly declining open interest. Next, watch for a breakout — if it’s accompanied by a sudden surge in open interest and volume, that’s your confirmation. For example, if SPY options are seeing frozen open interest at the 450 strike despite rising implied volatility, that’s a signal. Once a directional move occurs and open interest spikes, it may be time to enter — with proper risk controls.
Another approach is using consolidation to avoid false breakouts. If price moves outside a range but open interest doesn’t budge, it could be a head fake. That alone can save you from chasing noise.
Bottom Line
Open interest consolidation is like a market’s poker face — emotionless, quiet, but loaded with intent. It won’t tell you everything, but when combined with volume, volatility, and price action, it gives you a serious edge. Whether you’re trading options, futures, or even crypto derivatives, keeping an eye on these “quiet zones” can help you catch the next big wave — before it crashes onto the mainstream radar.