
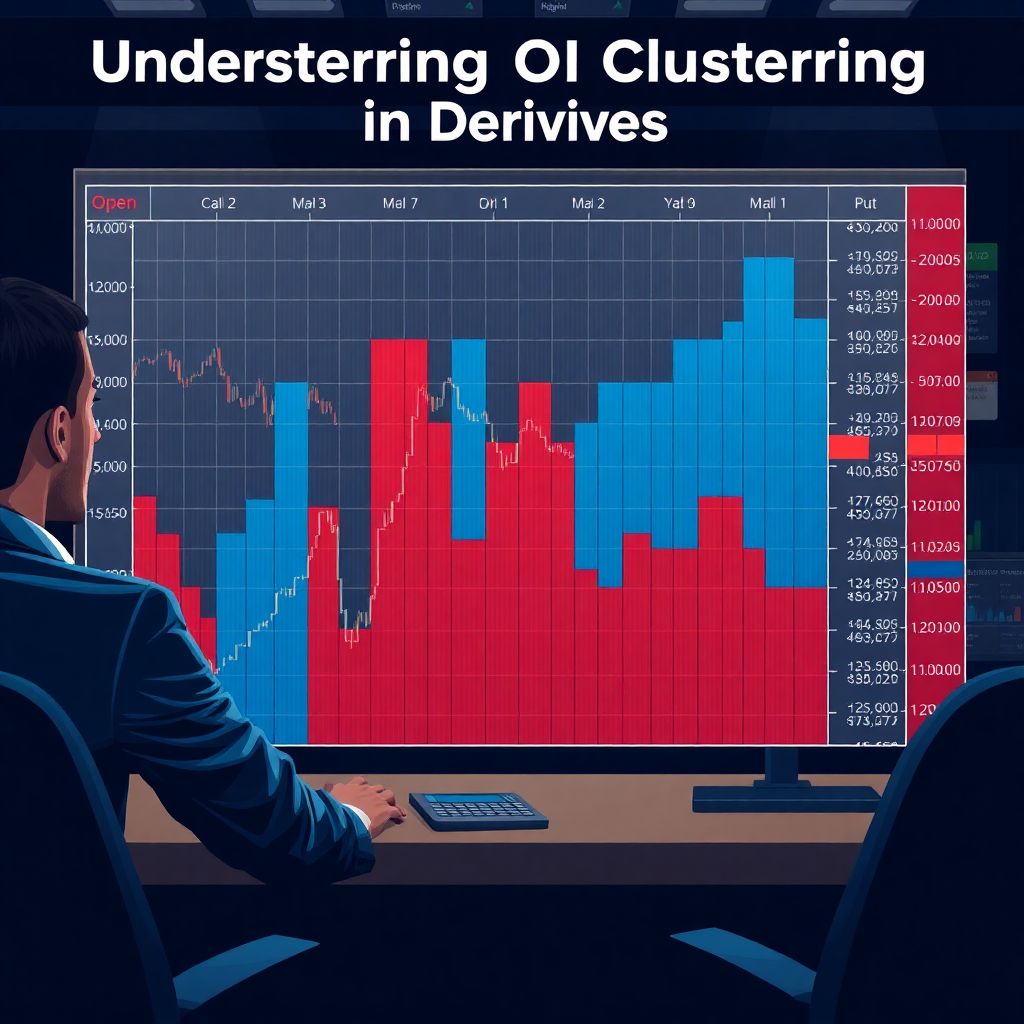
Understanding OI Clustering in Derivatives
Open Interest (OI) clustering is a powerful analytical technique applied in the derivatives market to identify potential support and resistance zones based on the distribution of open interest across various strike prices. In options trading, OI represents the total number of outstanding contracts that have not been settled. By observing how OI is distributed — particularly where it clusters — traders can infer market participants’ expectations and potential price magnets. These clusters often align with institutional positioning and can serve as key levels for trade entry and risk management.
OI clustering is especially relevant in index options and liquid equity derivatives, where volume and open interest are sufficiently high to allow for meaningful interpretation. When visualized effectively, OI clusters provide insights into market structure, likely pinning zones, and strike-specific sentiment. This data becomes even more potent when combined with price action, volatility metrics, and time decay considerations.
Step-by-Step Guide to Applying OI Clustering Visually
Step 1: Collect and Normalize OI Data
The first step involves extracting OI data for calls and puts across all strike prices for the instrument in question. This data is typically available from exchanges or through API feeds. Once collected, normalize the values to account for differences in lot size or contract specifications. This ensures comparability across strikes and allows for cleaner visual representation. Normalization may also involve adjusting for changes in OI over time to highlight dynamic shifts in positioning.
Step 2: Visualize with OI Histograms
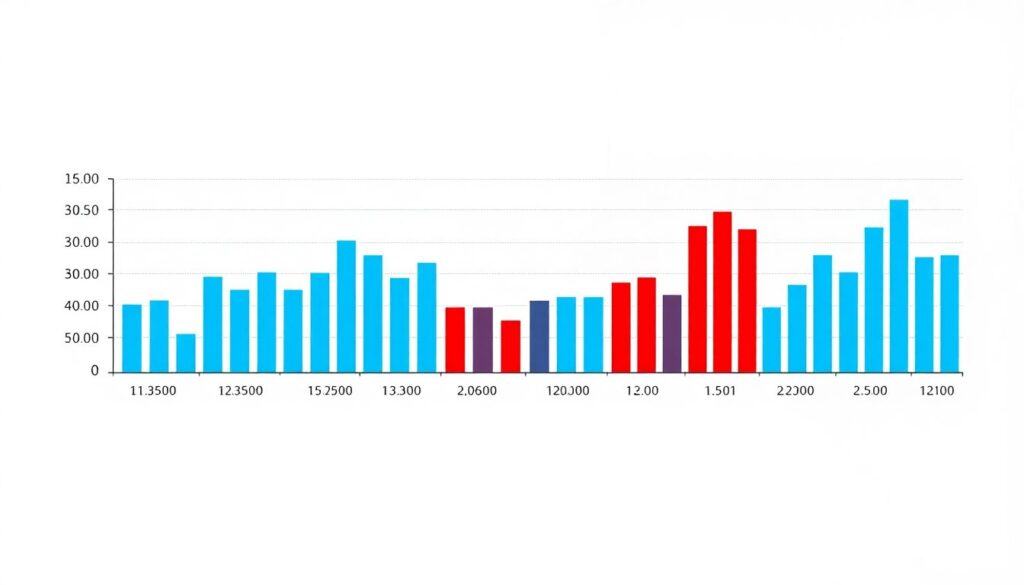
Plot the OI data using horizontal bar charts or histograms, with strike prices on the vertical axis and OI values on the horizontal. Separate call and put OI into different color schemes (e.g., blue for calls, red for puts) to distinguish directional sentiment. Clusters of high OI at specific strikes indicate areas of concentrated market interest. These levels often act as psychological barriers, with price gravitating toward them as expiry approaches due to gamma effects and hedging flows.
Step 3: Identify Key Clustering Zones
Look for contiguous zones where OI builds significantly across neighboring strikes. These clusters suggest institutional activity and potential price pinning levels. Pay particular attention to strikes with exceptionally high OI relative to adjacent levels — these are often magnet zones. Additionally, compare the ratio of call to put OI at each strike to gauge directional bias. A large call OI cluster above current price may indicate resistance, while a put-heavy cluster below may signal support.
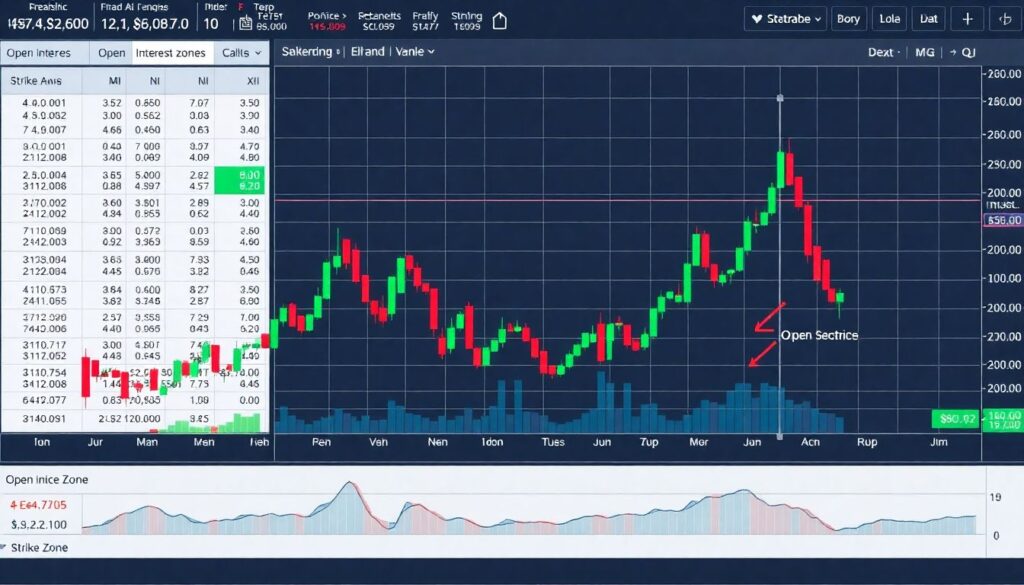
Step 4: Integrate with Price and Volatility
Overlay the OI clusters on price charts to contextualize market structure. Confirm whether price has reacted to these zones in the past. Combine this with implied volatility skew and historical volatility to assess the likelihood of price reaching or rejecting the cluster zones. For example, if implied volatility is elevated and price approaches a large OI cluster, one can anticipate increased gamma hedging activity, potentially amplifying price movement near that level.
Common Mistakes When Using OI Clustering
Mistake 1: Ignoring Time Sensitivity
A frequent error among beginners is treating OI clusters as static support/resistance levels without accounting for time decay. As options approach expiry, the influence of large OI clusters intensifies due to gamma effects. However, the same clusters may be less relevant when expiry is distant. Failing to consider the time to expiry can lead to misinterpretation of the cluster’s impact on price behavior. Always align your analysis with the option’s lifecycle.
Mistake 2: Misreading Synthetic Positions
Another pitfall is misinterpreting OI clusters without considering synthetic positions. For example, a trader might see high put OI at a strike and assume bearish sentiment. However, this could represent a bullish synthetic long (long put + short call + long underlying). Without analyzing volume and changes in OI (i.e., whether positions are being opened or closed), assumptions about sentiment can be misleading. Use net change in OI and volume to validate positioning logic.
Mistake 3: Over-Reliance on Static Snapshots
OI data is dynamic and can shift rapidly, particularly during volatile sessions. New traders often analyze a single snapshot of OI and build a thesis without tracking how clusters evolve intraday or across sessions. This leads to outdated interpretations and poor trade timing. Ideally, monitor OI changes in real time or at least daily to observe how sentiment and positioning adapt to price movement and news events.
Mistake 4: Disregarding Low Liquidity Strikes
Some traders include illiquid strikes in their cluster analysis, which skews interpretation. Strikes with negligible OI or sporadic volume do not offer meaningful insight and can introduce visual noise in cluster charts. Filter out low-liquidity strikes to focus on zones where institutional activity is concentrated. This enhances signal clarity and reduces the risk of acting on misleading data.
Tips for Beginners to Gain an Edge
Tip 1: Combine OI Clusters with Max Pain Theory
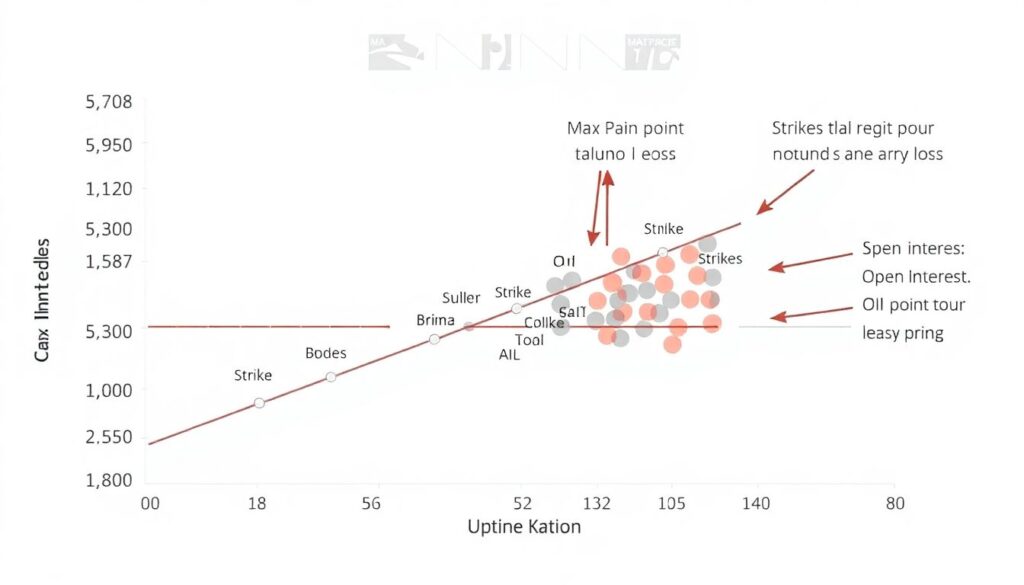
The Max Pain point — the strike price at which option sellers incur the least loss — often aligns with large OI clusters. By combining OI cluster analysis with Max Pain calculations, traders can better anticipate potential expiry pinning zones. While not foolproof, this synergy provides an additional layer of context for trade planning around option expiry.
Tip 2: Use Visual Heatmaps for Efficiency
To improve speed of analysis, employ OI heatmaps that color-code strikes based on OI density. This allows for quick identification of clusters and outliers. Advanced platforms offer dynamic heatmaps that update intraday, helping traders stay aligned with evolving market structure. Visual tools reduce cognitive load and enable faster decision-making during volatile sessions.
Tip 3: Monitor OI Delta and Gamma Exposure
Beyond raw OI, understanding the delta and gamma exposure of clustered strikes enhances predictive power. High gamma zones near price can lead to rapid moves due to dealer hedging. Tracking changes in delta exposure across strikes can also reveal shifting sentiment. Platforms like SpotGamma or custom scripts in Python can quantify these exposures and highlight actionable zones.
Tip 4: Backtest Cluster Reactions
Historical testing of how price reacts to OI clusters improves confidence in the methodology. Identify past instances of significant OI clustering and observe price behavior near these zones. This helps validate the relevance of certain strikes and refines your criteria for what constitutes a meaningful cluster. Over time, this empirical approach builds intuition and improves trade selection.
Conclusion
OI clustering is a nuanced but potent tool in the derivatives trader’s arsenal. When visualized and interpreted correctly, it reveals critical zones of market interest and potential price inflection points. However, its effectiveness hinges on dynamic analysis, contextual understanding, and avoidance of common pitfalls. By combining OI clustering with price action, volatility metrics, and institutional behavior, traders can develop a statistically grounded edge in options markets.