

Historical Background
If you strip away the buzzwords, OI rotation metrics grew out of a very practical problem: traders wanted to know *where the real money was moving* across futures and options, not just where prices were ticking. In early futures pits, pros were already watching open interest on chalkboards to track fresh participation. Once electronic trading took over, firms began logging derivatives market open interest data platform feeds, comparing shifts between related contracts and expiries. That’s when patterns appeared: when open interest drained from one instrument and bloomed in another, volatility tended to follow. Over time, quants formalised these observations into rules and dashboards for rotation tracking.
Basic Principles

At its core, an open interest rotation strategy asks a simple question: “Which instrument is currently attracting new commitment, and which one is being abandoned?” You’re not just checking whether OI is rising or falling, but *where* that OI is migrating along the curve or across correlated products. Experts recommend tracking three dimensions at once: absolute change in open interest, percentage change relative to float or free float, and price reaction during that change. When fresh OI supports a breakout, the move often sticks; when price moves without new OI, it’s usually weak and vulnerable to sharp reversals or mean reversion.
To turn this into something you can actually trade, you need a clear routine:
1. Define your “universe”: index futures, sector futures, key single-stock options, maybe FX futures.
2. Decide the time frame: intraday, daily, or weekly scans.
3. Rank instruments by net OI inflow and outflow.
4. Map flows to regimes: accumulation, distribution, rotation in, rotation out.
5. Translate regimes into precise rules for entries, exits, and position sizing.
This structure keeps the metrics from becoming another noisy indicator and turns them into repeatable futures open interest trading signals.
Implementation Examples
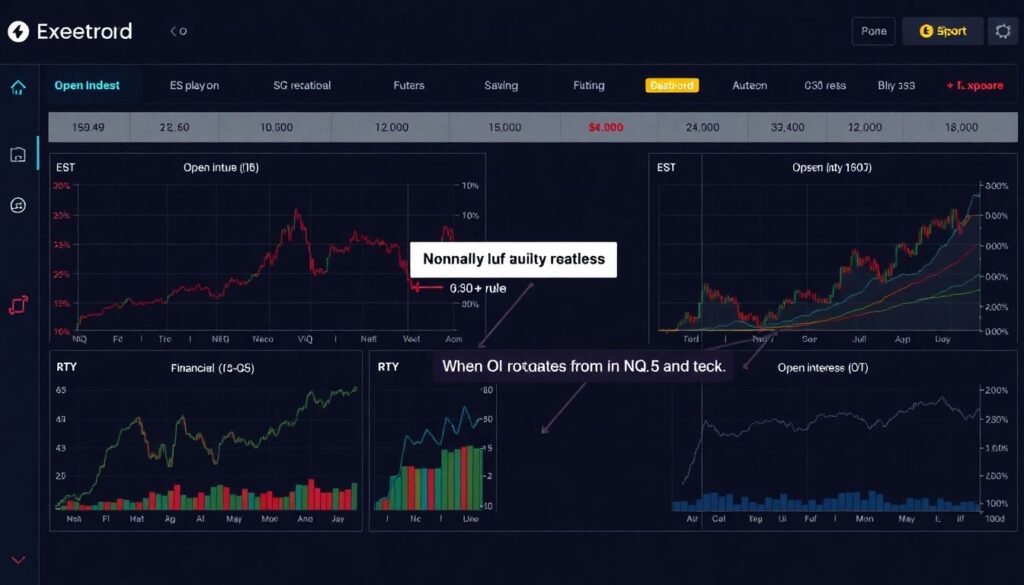
Imagine you trade equity index futures and sector futures. An expert-style dashboard might plot OI changes for ES, NQ, RTY plus financials and tech futures. If you see OI bleeding from ES while spiking in NQ and tech, that’s a classic risk-on growth rotation. One practical rule: reduce ES exposure, increase NQ or tech futures, and tighten stops on value-heavy positions. A good options open interest analysis tool will show the same story in calls and puts, confirming whether big players are adding convexity in the destination instruments or simply reshuffling linear futures exposure without significant optionality.
For short-term traders wondering how to use open interest for intraday trading, a simple but effective play is tracking OI shifts between front-month and next-month contracts around economic releases. If, right before data, front-month OI drops while next-month OI jumps, institutions are often kicking risk further out the curve. Pros watch that pattern and fade overly aggressive intraday moves in the front contract, expecting reduced follow‑through. Some desks also cross-check with a derivatives market open interest data platform to spot when single-stock option OI surges in the same direction, which often marks more durable sector rotations rather than brief sentiment swings.
Common Misconceptions
One frequent myth is that rising open interest is always bullish. Seasoned derivatives traders will tell you it simply means “more people have entered the game,” not that they’re all on the same side. OI can rise in both strong uptrends and vicious selloffs. What matters is *who* is likely behind the flows: hedgers, market makers, or directional funds. Experts suggest pairing OI rotation metrics with volume at price and volatility term structure; this helps you guess whether new OI is speculative, risk-transfer, or arbitrage driven, instead of taking every uptick in OI as a green light for aggressive long positions.
Another trap is treating OI rotation as self-sufficient without context. Traders sometimes chase every spike flagged by their open interest rotation strategy and end up overtrading noise: roll activity, calendar spreads, or simple hedging adjustments. Veteran quants advise filtering signals by minimum notional size, alignment with macro catalysts, and cross-confirmation across instruments. If futures OI rotates but options OI and implied volatility stay flat, it may just be mechanical flow. When both futures and options light up together, and price structure agrees, that’s when OI rotation metrics justify larger bets and more confident conviction sizing.