
OI Flow Reversals: Detecting Shifts Before Prices Move
Understanding the Role of Open Interest Flow
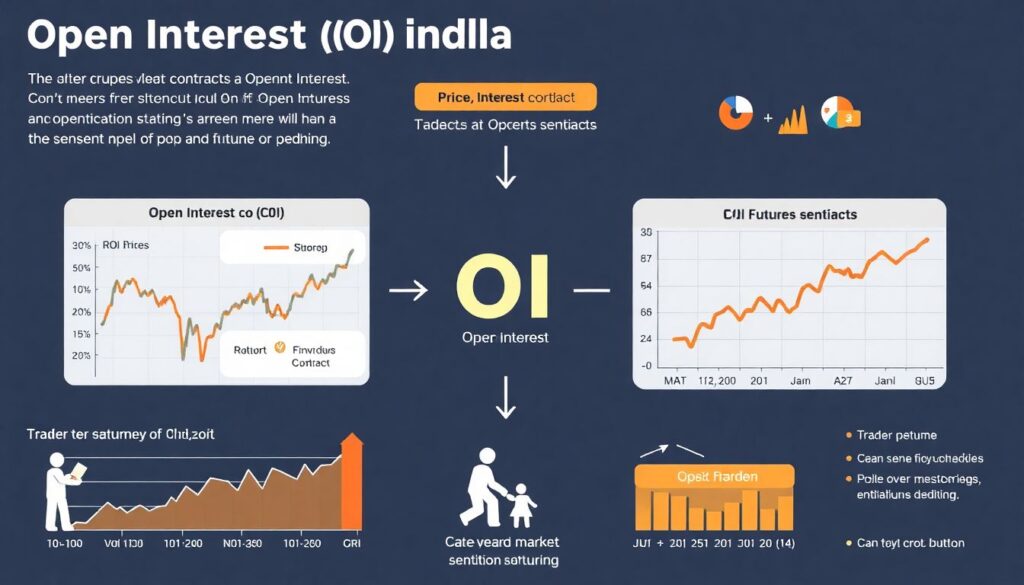
In the context of derivatives and futures trading, Open Interest (OI) is a critical indicator that reflects the total number of outstanding derivative contracts not yet settled. While price and volume often capture the spotlight, OI offers deeper insight into market sentiment and positioning. Tracking the flow of open interest—increases and decreases in contract activity—can reveal subtle shifts in market dynamics before price reacts. Specifically, OI flow reversals, or turning points in accumulated open positions, can serve as a leading indicator of potential price movement, especially when aligned with volume and price action.
OI flow reversals typically signal a change in the intention of market participants. For instance, a rise in open interest during a downward price trend might indicate new short positions being added, confirming the trend. Conversely, if open interest starts to decline while price stabilizes, it can be a clue that the trend is losing strength, possibly foreshadowing a reversal.
Required Tools and Data Sources
To effectively detect OI flow reversals, traders must equip themselves with accurate and timely data and appropriate analytical tools. The following are essential:
– Real-time Futures Data Feed: Delayed or inaccurate OI data undermines identification of actionable reversals.
– Charting Platform with OI Overlay: Platforms such as TradingView, Sierra Chart, or ThinkorSwim allow users to combine OI with price and volume.
– Historical OI and Volume Logs: Studying historical relationships between price, volume, and OI flow aids pattern recognition.
– Order Flow and Footprint Charts (optional): For advanced users, these tools provide granular insights into buyer and seller aggression alongside OI readings.
Step-by-Step Process to Detect OI Flow Reversals
Systematically analyzing OI for signs of directional change involves attention to interaction between price action, volume, and open interest across time frames. Here’s a structured approach:
1. Establish Current Trend Context: Identify the prevailing price trend using moving averages or structure-based analysis (e.g., swing highs/lows, market structure breaks).
2. Overlay OI and Volume: Apply open interest and volume indicators on your chart. Observe whether OI is expanding or contracting during the trend.
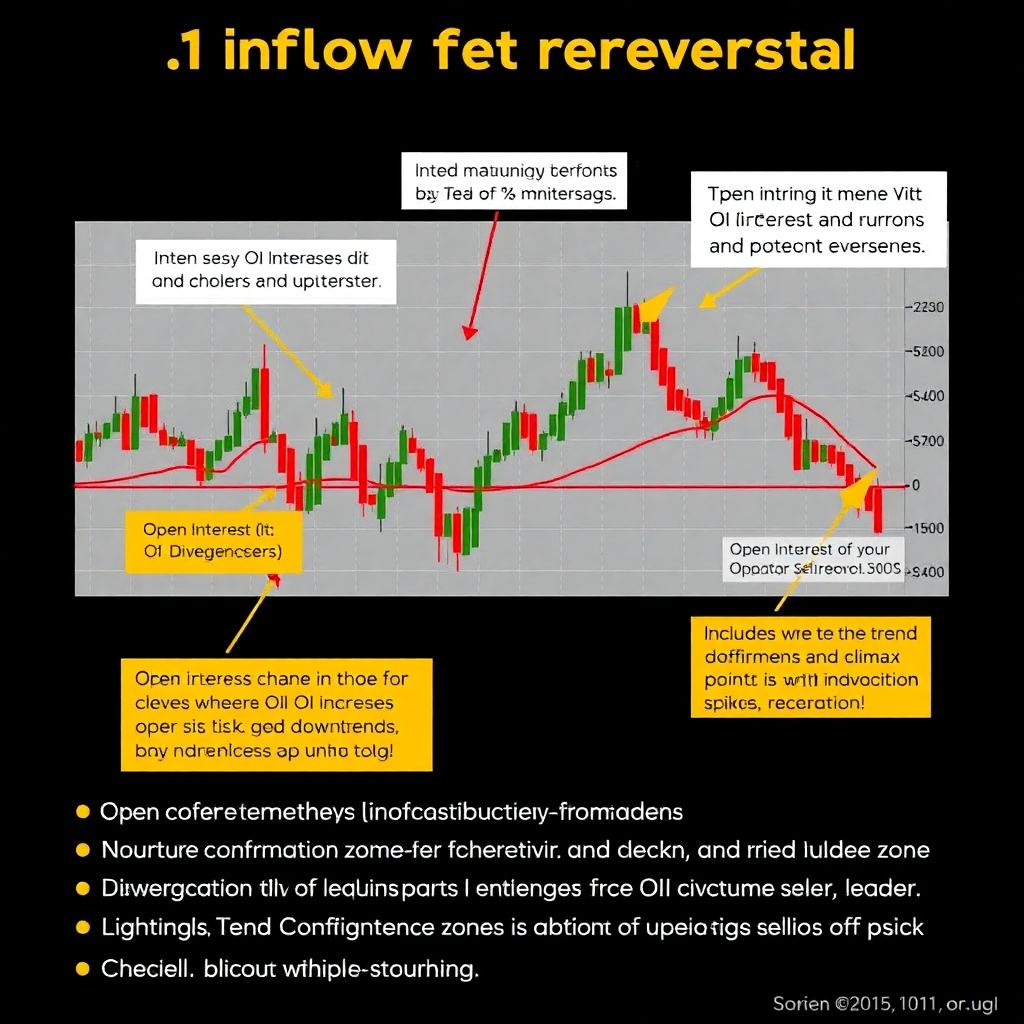
3. Detect Divergences:
– An OI increase during a price rally typically supports continuation.
– A divergence where OI decreases during a price rise could signal profit-taking or short-covering, not fresh bullish activity.
– Similarly, in downtrends, increasing OI with falling prices strengthens the bearish conviction; a drop in OI signals short liquidation.
4. Watch for Climax Points: Monitor for spikes in both OI and volume that coincide with exhaustion candles or rejection at key levels—these are often precursors to reversals.
5. Confirm with Price Action: Use candlestick confirmation or break of market structure to validate OI-based reversal signals before entering a position.
Common Mistakes Made by Beginners
New traders frequently misinterpret OI data due to a lack of contextual understanding or reliance on it in isolation. Below are typical pitfalls:
– Treating Every OI Shift as Predictive: Not all rises or drops in OI equate to meaningful market turns. OI should be interpreted relative to trend strength, volume, and price behavior.
– Ignoring Time Context: OI patterns unfold over different time horizons. Intraday traders may overreact to minor fluctuations that are insignificant in a broader context.
– Confusing Short Covering with Long Interest: A falling OI during a price rally often represents closing short positions, not new longs—a nuance that often traps inexperienced traders.
Other common beginner errors include:
– Relying on daily OI data for scalping or short-term trades.
– Misreading seasonal or contract rollover effects as genuine reversals.
– Overcomplicating analysis by using excessive indicators alongside OI, leading to confirmation bias or analysis paralysis.
Troubleshooting and Refinement Guidelines

When OI-based signals fail to play out as expected, it’s critical to revisit the assumptions and execution process. Some troubleshooting strategies include:
– Reassess the Trend Definition: Misidentifying ranges as trends can lead to false OI interpretations. Use higher time frame structure for clarity.
– Correlate with Market Events: Sudden OI moves may be driven by external factors like economic data releases or geopolitical news—contextual awareness is crucial.
– Monitor Liquidity and Contract Expiry: OI naturally declines during contract expirations or holidays; misreading this noise can lead to poor decisions.
– Backtest Patterns: Analyze historical OI reversals on similar instruments under matching conditions. This builds a reference for expected outcomes and uncovers anomalies.
Additionally, consider keeping a journal of trades based on OI flow interpretation. Documenting hypothesis, entry criteria, context, and result sharpens analytical accuracy over time.
Conclusion
OI flow reversals, when correctly interpreted in the broader context of volume and price action, provide a powerful forward-looking lens into potential market shifts. However, the key lies in disciplined observation, contextual understanding, and avoiding simplistic assumptions. By combining structured analysis with continuous refinement, traders can harness open interest to anticipate turning points before price reacts—transforming insight into strategic edge.