

Understanding Skew Surfaces in Equities: Insights for Traders
In the ever-evolving landscape of equity derivatives, the concept of skew surfaces has become a vital tool for traders seeking to interpret market sentiment and price risk accurately. As we step into 2025, skew surfaces are no longer just a theoretical construct—they are actively shaping trading strategies, risk management frameworks, and even alpha generation models.
What Is a Skew Surface?
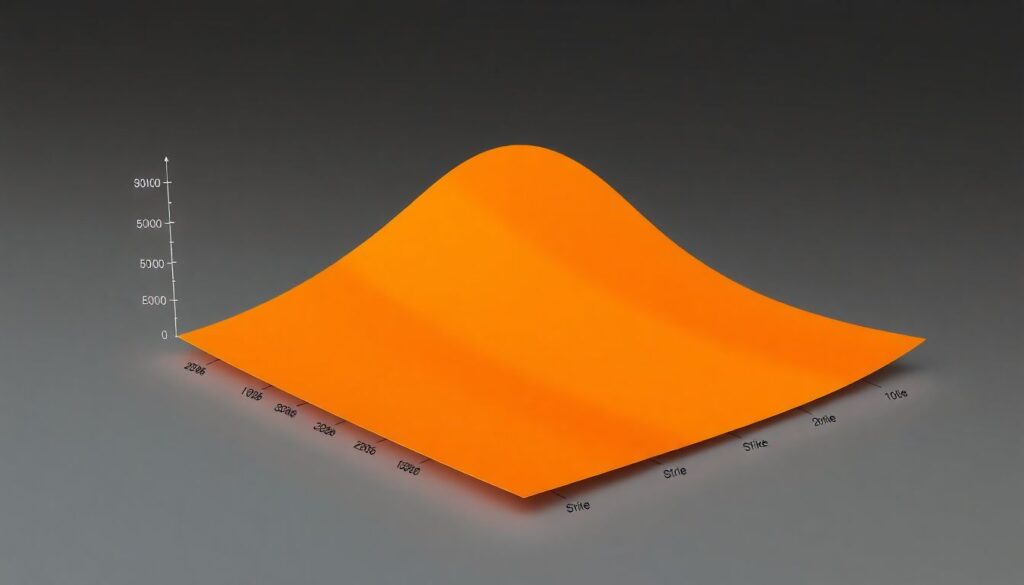
A skew surface represents the implied volatility of options across different strikes and maturities. While the term “volatility skew” often refers to the variation of implied vol across strike prices (for a fixed expiry), the skew surface extends this idea into two dimensions: strike and time to maturity. This surface provides a three-dimensional view of how the market prices risk and uncertainty for a particular underlying equity.
For example, in the S&P 500 options market, the implied volatility for deep out-of-the-money (OTM) puts is typically higher than for at-the-money (ATM) or OTM calls. This persistent feature reflects the market’s fear of sharp downside moves—a phenomenon that became especially pronounced during the March 2020 COVID crash and has remained structurally embedded ever since.
Technical Snapshot: Constructing the Skew Surface
To build a skew surface, traders and quants use the following inputs:
– Strike range: Typically from 70% to 130% of the spot price
– Maturities: From weekly options to LEAPS (Long-term Equity Anticipation Securities)
– Interpolation models: SVI (Stochastic Volatility Inspired), SABR, or parametric cubic splines
Once constructed, the surface allows traders to extract local volatilities, detect arbitrage opportunities, and model future price paths using Monte Carlo simulations or finite difference methods.
Real-World Example: Tesla (TSLA) Skew Dynamics
Consider Tesla Inc. (TSLA), a stock known for its volatility and retail-driven flows. In late 2024, after a surprise earnings beat and a 15% rally, the skew surface flattened significantly. OTM call vols rose sharply, while downside put vols compressed. This inversion of the typical skew suggested a short-term shift in market positioning—likely driven by aggressive call buying from retail traders and gamma hedging from market makers.
Traders who recognized this shift were able to construct risk-reversal strategies (long call, short put) with favorable risk/reward profiles. Others used the flattening skew to fade the rally via call spreads, anticipating mean reversion in both price and implied vol.
Key Insights for Traders in 2025
As of 2025, skew surfaces are providing more than just pricing inputs—they are becoming predictive tools in their own right. Here are several strategic takeaways:
– Sentiment gauge: A steep downside skew often signals institutional hedging activity, while a flattening skew may indicate complacency or speculative froth.
– Relative value trades: Traders are increasingly comparing skew surfaces across similar equities (e.g., NVIDIA vs. AMD) to identify mispricings.
– Volatility regime shifts: Changes in the skew surface often precede shifts in realized volatility, making them useful for timing vol trades.
Advanced Use Cases: Machine Learning Meets Skew
In 2025, machine learning models are being trained not just on price and volume, but also on features extracted from skew surfaces. Hedge funds are using PCA (Principal Component Analysis) on historical skew surfaces to identify latent factors that drive volatility dynamics.
Notably, some funds are now incorporating real-time skew surface data into reinforcement learning algorithms that dynamically adjust delta-hedged portfolios. This represents a significant leap from traditional Black-Scholes-based hedging.
Looking Ahead: The Future of Skew Surfaces

As equity markets become more fragmented and options trading continues to migrate to shorter tenors (weekly and even daily expirations), skew surfaces are expected to grow in complexity and importance. Several trends are likely to shape the evolution of skew analysis:
– Increased granularity: With the rise of zero-day-to-expiry (0DTE) options, intraday skew surfaces are becoming a new frontier for high-frequency traders.
– Cross-asset integration: Equity skew is being analyzed alongside FX and rates skew to build macro-volatility correlation models.
– Retail impact: As retail participation in options grows, especially via platforms like Robinhood and Webull, skew surfaces are becoming more reactive to non-institutional flows.
Forecast for 2025–2027
We expect skew surfaces to play a central role in:
– Tail risk hedging: As geopolitical and macroeconomic uncertainties persist, demand for structured products with embedded skew exposure will rise.
– Volatility arbitrage: Sophisticated funds will increasingly trade the shape and curvature of skew surfaces using dispersion and correlation strategies.
– Regulatory scrutiny: With the growth of 0DTEs and retail-driven vol spikes, regulators may begin mandating more transparency in implied volatility modeling.
Conclusion

For equity traders in 2025, understanding and utilizing skew surfaces is no longer optional—it’s essential. Whether you’re a discretionary trader looking for sentiment cues or a quant building volatility surfaces from tick data, the skew surface is a powerful lens through which to interpret market dynamics. As the tools and data continue to evolve, those who can read the surface—literally and figuratively—will be best positioned to capture asymmetric returns in increasingly complex markets.