
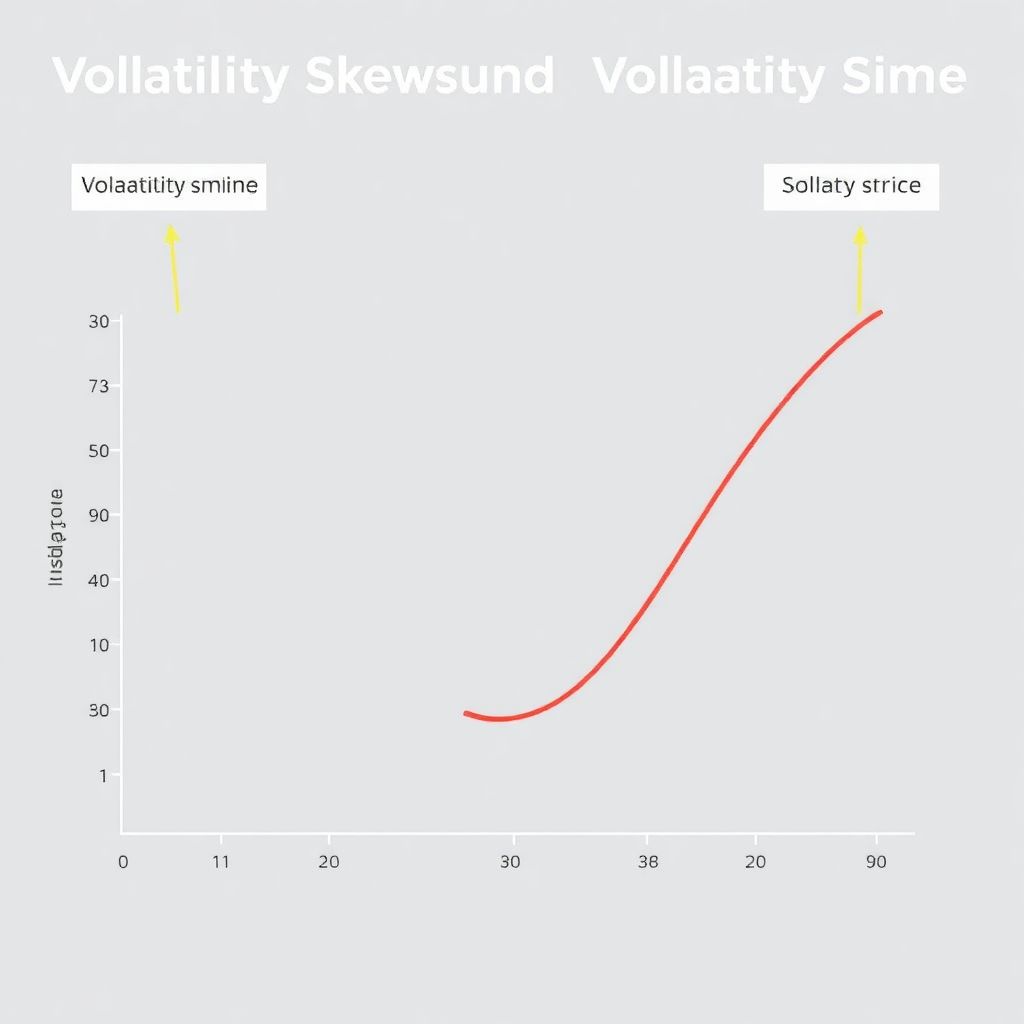
Understanding the Basics: What Are Skew and Smile?
In the realm of options pricing, implied volatility (IV) is rarely symmetric. Two primary metrics—volatility skew and volatility smile—help traders interpret these asymmetries. Volatility smile describes a U-shaped curve where deep in-the-money and out-of-the-money options have higher implied volatilities than at-the-money options. In contrast, skew (particularly “volatility skew”) reflects directional bias—when IV consistently rises or falls with strike price. These patterns stem from market expectations, demand pressure, and risk perception, making them essential tools for both hedging and speculative strategies.
Real Market Behavior: Case Studies From 2022–2024
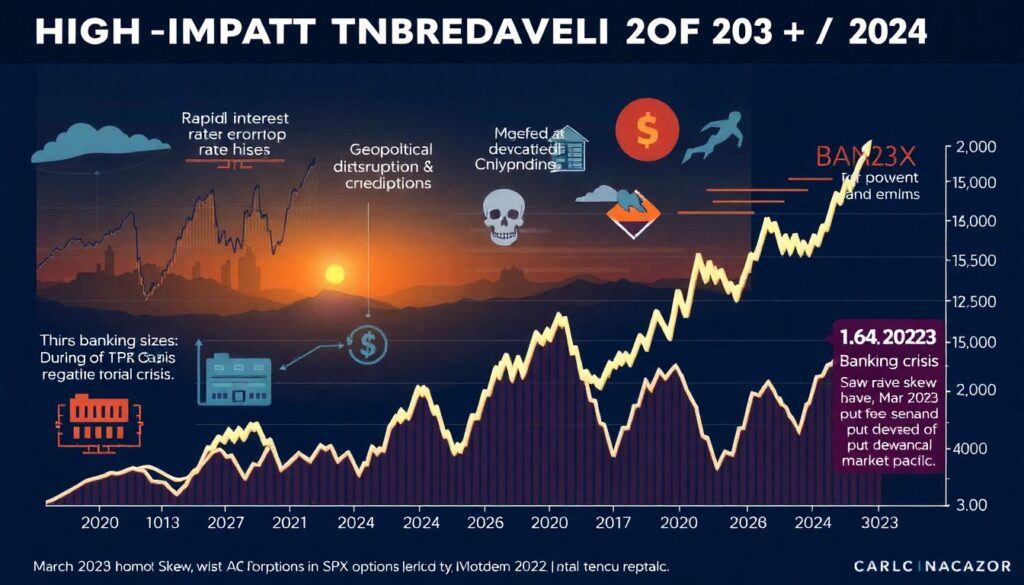
Between 2022 and 2024, high-impact events such as rapid interest rate hikes and geopolitical disruptions deeply influenced skew and smile patterns. For example, during the March 2023 banking crisis, SPX options exhibited pronounced negative skew—indicating elevated put demand amid panic. According to CBOE data, 25-delta put implied volatility surged to 26%, compared to 18% for at-the-money calls. Meanwhile, in the post-COVID recovery phase of 2022, crypto options on BTC frequently displayed volatility smiles, especially during high retail speculation periods. These real-world shifts demonstrate how different assets and regimes trigger divergent responses in IV structures.
Non-Obvious Trade-Offs: When Each Metric Matters
Choosing between skew and smile metrics isn’t merely academic—it can redefine your edge. Skew is more useful in markets with directional hedging pressure (e.g., equity indices), while smile provides more insight into tail risk pricing in symmetric distributions, such as commodities and crypto. However, the non-obvious truth is that relying heavily on either may mislead. Traders who interpreted a steep skew in VIX options in late 2023 as a signal of downside risk missed the rally, as the skew was driven more by supply imbalances than fear. Thus, understanding context and flow data is as vital as the metric itself.
Alternative Approaches to Volatility Analysis
While skew and smile are standard tools, advanced practitioners have moved toward more nuanced models. These include:
1. Volatility Surface Modeling – Using 3D interpolations of strike and maturity to capture the full dynamics of IV.
2. Realized vs. Implied Spread – Measuring how far implied vol differs from actual realized volatility to detect mispricings.
3. Risk Reversal Ratios – Comparing out-of-the-money calls vs. puts to gauge directional sentiment beyond simple skew.
4. Machine Learning Forecasts – Leveraging historical IV + macro inputs to simulate future skew/smile profiles.
These alternatives require deeper data sets and computational resources but offer richer insight, especially in high-frequency or cross-asset strategies.
Pro-Level Tactics: Extracting Alpha from Vol Metrics
Professional traders often apply volatility metrics not just as signals but as relative value tools. Here are some tactical edge enhancers:
1. Monitor Skew Delta Changes Intraday – Subtle shifts in skew during news events often preempt large spot moves.
2. Compare Smile Across Tenors – A steep smile in short-dated options but flat in long-dated may signal near-term event risk.
3. Synthetic Skew Construction – Build skew exposure synthetically via call/put spreads to avoid market impact.
4. Cross-Market Skew Arbitrage – Arbitraging skew between correlated assets, like SPY vs. QQQ, can yield alpha in volatile regimes.
These techniques require precision and timely execution, but they underscore how sophisticated traders can turn volatility metrics into tradable insights rather than descriptive analytics.
Conclusion: Metrics in Context, Not in Isolation

Ultimately, neither skew nor smile serves as a silver bullet. Their utility lies in contextual application, asset class specificity, and integration with broader macro or micro signals. As of 2024, data from the OCC revealed that skew steepness in equity index options rose by 18% YoY, while smile curvature in crypto options flattened due to maturation of the asset class. These dynamics underscore that successful volatility trading depends on adaptation, not just formulas. The right choice between skew and smile isn’t static—it’s situational, informed, and constantly evolving.