
In the last few years options traders have quietly shifted from “directional bets” to mining volatility around specific catalysts. Earnings, FDA decisions, FOMC meetings — these are no longer just calendar notes, they’re volatility factories. From 2022 through 2023, OCC reports that total listed options volume grew about 19%, but single‑stock options around earnings weeks consistently showed higher spikes, with daily volumes up 30–40% versus non‑event weeks for many large caps. That growth is not just about more people clicking buttons; it’s about traders trying to squeeze a timely edge out of options skew in event‑driven trading, where the shape of implied volatility across strikes and expirations becomes the real playing field.
Step 1. Understand what “skew” really is (without the jargon haze)
Most platforms draw implied volatility as a smile or a skew curve. Under normal, calm conditions, that curve is slightly downward sloping for equities: puts are richer than calls because people fear crashes more than moonshots. Before earnings or macro data, though, the curve mutates. The front expiry explodes in volatility, wings can get bid up, and out‑of‑the‑money calls may suddenly trade like lottery tickets. Between 2022 and 2024 this effect intensified: bank research showed short‑dated implied vol on big tech names running 2–3 times their 30‑day realized vol in the 48 hours before earnings, far higher than the 1.5–2x levels common pre‑2020. Skew is just the fingerprint of that fear and greed on the option chain.
Step 2. Event‑driven context: why timing matters more than genius
An event driven options trading strategy is not about predicting the event itself with magical accuracy; it’s about understanding how the market will price uncertainty before and after the announcement. For example, from 2022 to 2024, average absolute earnings‑day moves for S&P 500 stocks were roughly 4–5%, while implied moves embedded in at‑the‑money straddles often priced 5–7%. That gap means that, on average, options were slightly “over‑insured” into earnings, especially in crowded tech names. Your timely edge comes from measuring how skew inflates as the event approaches, then deciding whether you want to sell that insurance (carefully) or own mispriced wings where the crowd is looking the wrong way.
Step 3. How to read skew around earnings in practice
Let’s walk through how to trade options skew around earnings using a simple workflow. A few days before the report, compare implied volatility for the front earnings expiry against the next one or two expirations. In 2022–2024, it was common to see front‑week IV at 80–120% annualized while the next month sat near 30–40% for volatile growth names. Then look at strike skew: are downside puts 5–10 vol points richer than at‑the‑money? Are upside calls bid because everyone expects a blowout quarter? Once you see this picture, you stop asking “Will the stock go up?” and start asking “Which part of this curve is mispriced relative to the actual risk and recent realized moves?”
Step 4. Core options volatility skew trading strategies
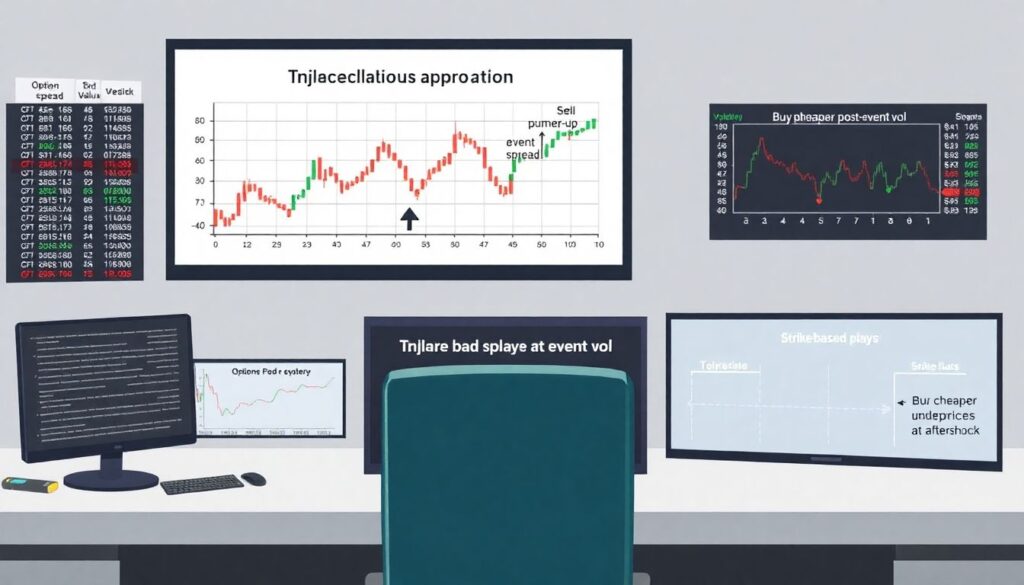
There are three bread‑and‑butter approaches most traders start with. First, relative value between expiries: calendar spreads where you sell pumped‑up event volatility and buy cheaper post‑event vol, or vice versa if the market underprices the aftershock. Second, strike‑based plays: vertical spreads or ratio spreads that lean against extreme skew — for example, selling very rich downside puts while hedging with closer strikes. Third, wings and “crash up” trades: cheap far‑out calls or puts when the skew is lopsided. Between 2022 and mid‑2024, backtests on large‑cap earnings showed that selling the most overpriced 10‑delta puts while hedging with 25‑delta options improved risk‑adjusted returns versus naked short straddles by cutting tail losses by about a third in major downside surprises.
Step 5. Building a simple event‑driven options trading workflow
Let’s make this concrete. Start by creating an earnings calendar of liquid names, then narrow to symbols with deep options markets. Next, scan for unusual changes in term structure and skew two to five days before the event. During 2022‑2024, studies on U.S. equity options showed that names with the largest pre‑earnings IV run‑up relative to their own 1‑year history tended to see the sharpest “vol crush” afterwards, often a 30–50% collapse in front‑expiry IV in 24 hours. Your workflow should therefore tag names where front‑week IV is in the top decile of its 1‑year range, and where downside or upside skew is unusually steep versus the last few quarters’ reports.
Step 6. Tools: scanners, data, and what really matters
You don’t need a hedge‑fund tech stack, but you do need structure. For most retail traders, the best options scanner for event driven trading is the one that lets you screen by implied volatility rank, upcoming catalysts, and skew metrics across strikes and expiries in real time. Focus on features like: visual IV term structure, delta‑based skew (10‑delta vs 25‑delta options), and historical earnings move statistics. Between 2022 and 2024 many brokers added “expected move” and IV percentile panels precisely because this became a mainstream edge. Don’t get lost in exotic Greeks; if your scanner clearly shows how today’s skew compares with the last 8 earnings cycles, you’re already far ahead of the average click‑trader.
Step 7. Common beginner mistakes (and how to dodge them)
The classic disaster is selling front‑week premium just because “IV is high” without checking that the underlying routinely overshoots expectations. From 2022‑2024, around 20–25% of S&P 500 earnings reports produced moves larger than the implied move priced the day before, and those outliers did most of the damage to short‑vol sellers. Another frequent mistake is ignoring correlation and macro events: skew around a big FOMC or CPI print can behave very differently from single‑stock earnings because the whole index can gap. New traders also underestimate gap risk: stops don’t work reliably across overnight earnings, so risk must be sized in advance, not managed with intraday tinkering.
Step 8. Risk management rules tailored to skew trades
Build hard guardrails. First, cap the percentage of your account exposed to short convexity into any single event; many semi‑professional traders keep it under 2–3% of equity at maximum loss. Second, use defined‑risk spreads instead of naked short options until you’ve survived at least a few full earnings seasons. In 2022‑2023 volatility spikes around surprise guidance or regulatory news led to several 3–5 standard deviation moves in single names; defined‑risk structures meant the difference between a bad loss and an account‑killer. Finally, always stress‑test: if the stock moves 2x the implied move, what happens to your P&L? If you can’t answer that before entering, you’re gambling, not trading.
Step 9. Turning stats into an actual edge, not trivia
Statistics are only useful if they shape your behavior. Here’s how to use them. Look at the last 8–12 earnings for a stock and record three numbers: average implied move the day before, actual absolute move, and post‑earnings IV crush. From 2022‑2024, many mega‑caps showed a pattern: implied moves drifting higher as retail options activity exploded, while realized moves stayed stable or even shrank as companies guided more cautiously. When you see implied consistently 1–2 percentage points above realized, that’s a signal to favor premium‑selling structures — but always with skew‑aware spreads, not blind short straddles. Flip that logic for small caps or biotech, where realized often beats implied; there you pay attention to underpriced wings.
Step 10. How to learn faster: practice, review, and structured education

If you’re just starting, paper‑trade at least one full earnings season with small, realistic position sizes. Log each trade: what skew looked like, what you expected, what actually happened. After a quarter or two you’ll see your personal patterns of error. At that point, consider a professional options trading course on volatility skew — not for secret signals, but to get frameworks for modeling term structure, smile dynamics, and risk. Combine that structured learning with your own stats and you’ll stop chasing random “setups” and start running a repeatable event‑driven playbook that fits your risk tolerance, time availability, and psychological profile. That’s where the timely edge from options skew really becomes sustainable.